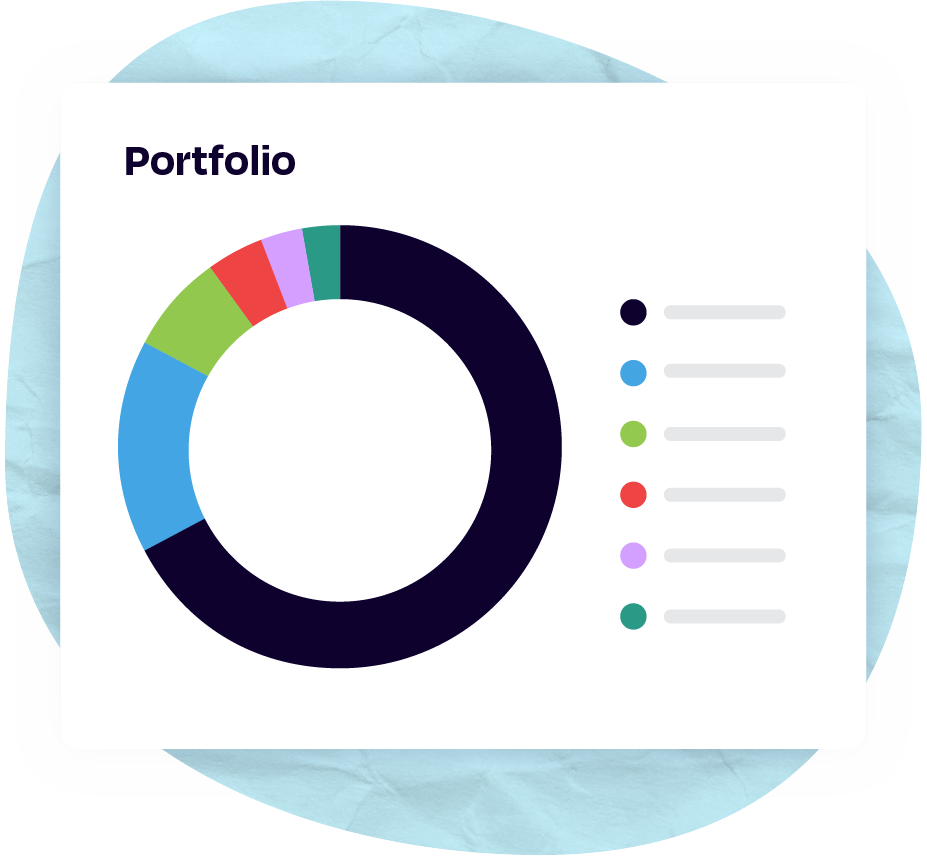
Our portfolios

Our track record

Trusted for decades

Octopus was founded in 2000 as an investment company – today Octopus Group is trusted by investors all over the UK to manage £9.6 billion.*

Managed by experts

Our portfolios are built by industry experts. We monitor and adjust them continually, so you don’t have to worry about daily market movements.

Performance

Our managed portfolios are globally diversified and have delivered returns that often beat benchmarks (based on data from Asset Risk Consultants).

See how we perform

Here’s 10 of our portfolios and their performance over the past 5 years. Portfolio 1 represents our most conservative approach (for those who prefer taking lower levels of risk to prevent potential losses) and Portfolio 10 represents our most adventurous approach (for those willing to take higher levels risk for potentially greater returns).

Portfolio 1

From to

Octopus Money Portfolio 1

Competitor Equivalent

The graph above shows the performance of the Octopus Money portfolio for the 5 years between 30/09/2020 and 30/09/2025 vs. average peer group performance over the same time period. Past performance is no indicator of future performance. The peer group data is taken from Asset Risk Consultants’ (ARC) Sterling Cautious Private Client Index (PCI). The performance does not take into account the impact of fees. When you invest with us, you’ll receive a detailed fact sheet and projection including the impact of fees on your investments.

Portfolio 2

From to

Octopus Money Portfolio 2

Competitor Equivalent

The graph above shows the performance of the Octopus Money portfolio for the 5 years between 30/09/2020 and 30/09/2025 vs. average peer group performance over the same time period. Past performance is no indicator of future performance. The peer group data is taken from Asset Risk Consultants’ (ARC) Sterling Cautious Private Client Index (PCI). The performance does not take into account the impact of fees. When you invest with us, you’ll receive a detailed fact sheet and projection including the impact of fees on your investments.

Portfolio 3

From to

Octopus Money Portfolio 3

Competitor Equivalent

The graph above shows the performance of the Octopus Money portfolio for the 5 years between 30/09/2020 and 30/09/2025 vs. average peer group performance over the same time period. Past performance is no indicator of future performance. The peer group data is taken from Asset Risk Consultants’ (ARC) Sterling Cautious Private Client Index (PCI). The performance does not take into account the impact of fees. When you invest with us, you’ll receive a detailed fact sheet and projection including the impact of fees on your investments.

Portfolio 4

From to

Octopus Money Portfolio 4

Competitor Equivalent

The graph above shows the performance of the Octopus Money portfolio for the 5 years between 30/09/2020 and 30/09/2025 vs. average peer group performance over the same time period. Past performance is no indicator of future performance. The peer group data is taken from Asset Risk Consultants’ (ARC) Sterling Balanced Asset Private Client Index (PCI). The performance does not take into account the impact of fees. When you invest with us, you’ll receive a detailed fact sheet and projection including the impact of fees on your investments.

Portfolio 5

From to

Octopus Money Portfolio 5

Competitor Equivalent

The graph above shows the performance of the Octopus Money portfolio for the 5 years between 30/09/2020 and 30/09/2025 vs. average peer group performance over the same time period. Past performance is no indicator of future performance. The peer group data is taken from Asset Risk Consultants’ (ARC) Sterling Balanced Asset Private Client Index (PCI). The performance does not take into account the impact of fees. When you invest with us, you’ll receive a detailed fact sheet and projection including the impact of fees on your investments.

Portfolio 6

From to

Octopus Money Portfolio 6

Competitor Equivalent

The graph above shows the performance of the Octopus Money portfolio for the 5 years between 30/09/2020 and 30/09/2025 vs. average peer group performance over the same time period. Past performance is no indicator of future performance. The peer group data is taken from Asset Risk Consultants’ (ARC) Sterling Balanced Asset Private Client Index (PCI). The performance does not take into account the impact of fees. When you invest with us, you’ll receive a detailed fact sheet and projection including the impact of fees on your investments.

Portfolio 7

From to

Octopus Money Portfolio 7

Competitor Equivalent

The graph above shows the performance of the Octopus Money portfolio for the 5 years between 30/09/2020 and 30/09/2025 vs. average peer group performance over the same time period. Past performance is no indicator of future performance. The peer group data is taken from Asset Risk Consultants’ (ARC) Sterling Steady Growth Private Client Index (PCI). The performance does not take into account the impact of fees. When you invest with us, you’ll receive a detailed fact sheet and projection including the impact of fees on your investments.

Portfolio 8

From to

Octopus Money Portfolio 8

Competitor Equivalent

The graph above shows the performance of the Octopus Money portfolio for the 5 years between 30/09/2020 and 30/09/2025 vs. average peer group performance over the same time period. Past performance is no indicator of future performance. The peer group data is taken from Asset Risk Consultants’ (ARC) Sterling Steady Growth Private Client Index (PCI). The performance does not take into account the impact of fees. When you invest with us, you’ll receive a detailed fact sheet and projection including the impact of fees on your investments.

Portfolio 9

From to

Octopus Money Portfolio 9

Competitor Equivalent

The graph above shows the performance of the Octopus Money portfolio for the 5 years between 30/09/2020 and 30/09/2025 vs. average peer group performance over the same time period. Past performance is no indicator of future performance. The peer group data is taken from Asset Risk Consultants’ (ARC) Sterling Equity Risk Private Client Index (PCI). The performance does not take into account the impact of fees. When you invest with us, you’ll receive a detailed fact sheet and projection including the impact of fees on your investments.

Portfolio 10

From to

Octopus Money Portfolio 10

Competitor Equivalent

The graph above shows the performance of the Octopus Money portfolio for the 5 years between 30/09/2020 and 30/09/2025 vs. average peer group performance over the same time period. Past performance is no indicator of future performance. The peer group data is taken from Asset Risk Consultants’ (ARC) Sterling Equity Risk Private Client Index (PCI). The performance does not take into account the impact of fees. When you invest with us, you’ll receive a detailed fact sheet and projection including the impact of fees on your investments.